
Appendix B. Analysis of GNSS data.
During GNSS data processing, it is essential to monitor satellite availability, their spatial distribution, and the quality of received signals. Specialized visualization tools are used for this purpose, each providing data for analysis.
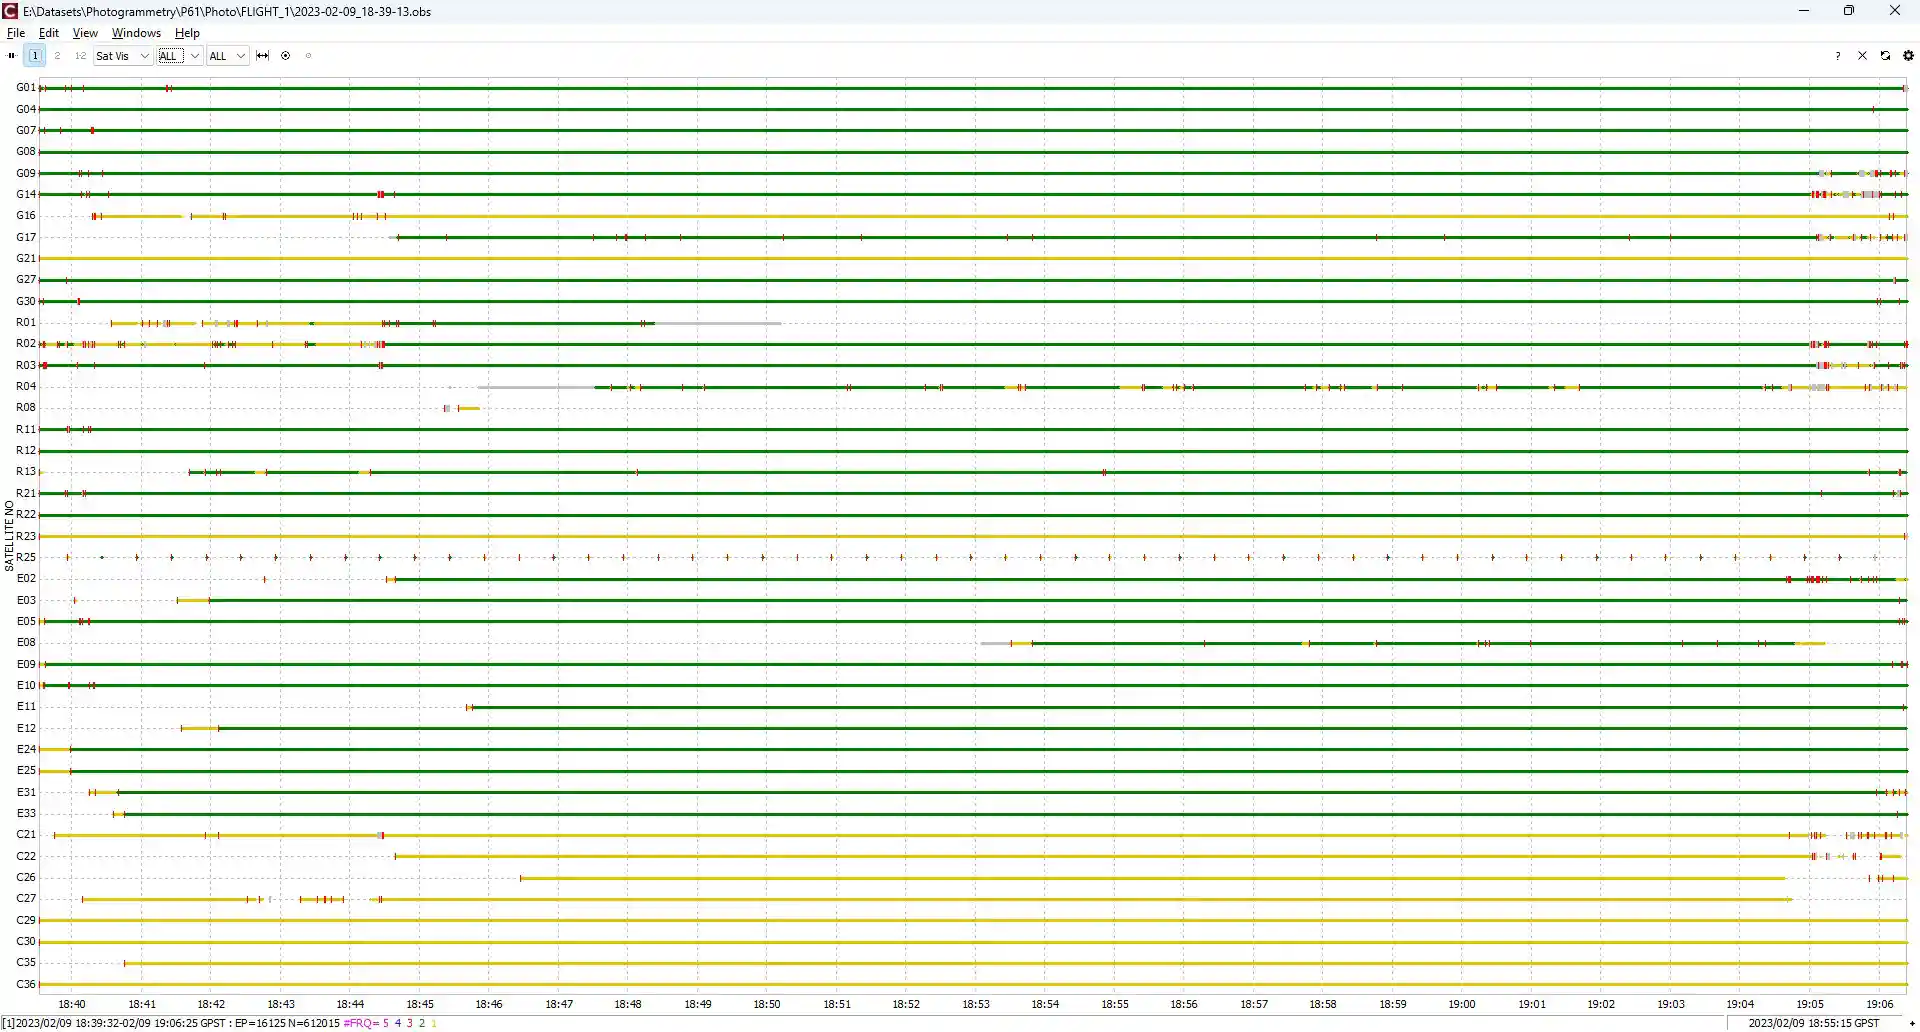
The Sat Vis (Satellite Visibility) window displays GNSS satellite visibility in dynamic graphical or tabular format, recording satellite availability for the receiver at specific time points.
Graph Structure:
-
X-axis: Time scale corresponding to the measurement session duration.
-
Y-axis: List of satellites with their respective navigation systems (e.g., G – GPS, R – GLONASS, E – Galileo, C – BeiDou).
-
Lines/bars: Represent periods when a satellite is visible to the receiver.
-
Color coding: Indicates GNSS signal frequency bands (e.g., yellow – L1, green – L1+L2, etc.).
Each bar corresponds to an individual satellite.
Bar length indicates satellite availability duration.
Gaps represent signal loss periods (e.g., due to obstructions).
Increasing the number of simultaneously tracked satellites can improve geometric diversity, reducing the DOP (Dilution of Precision) value. However, insufficient visible satellites may significantly degrade positioning accuracy.
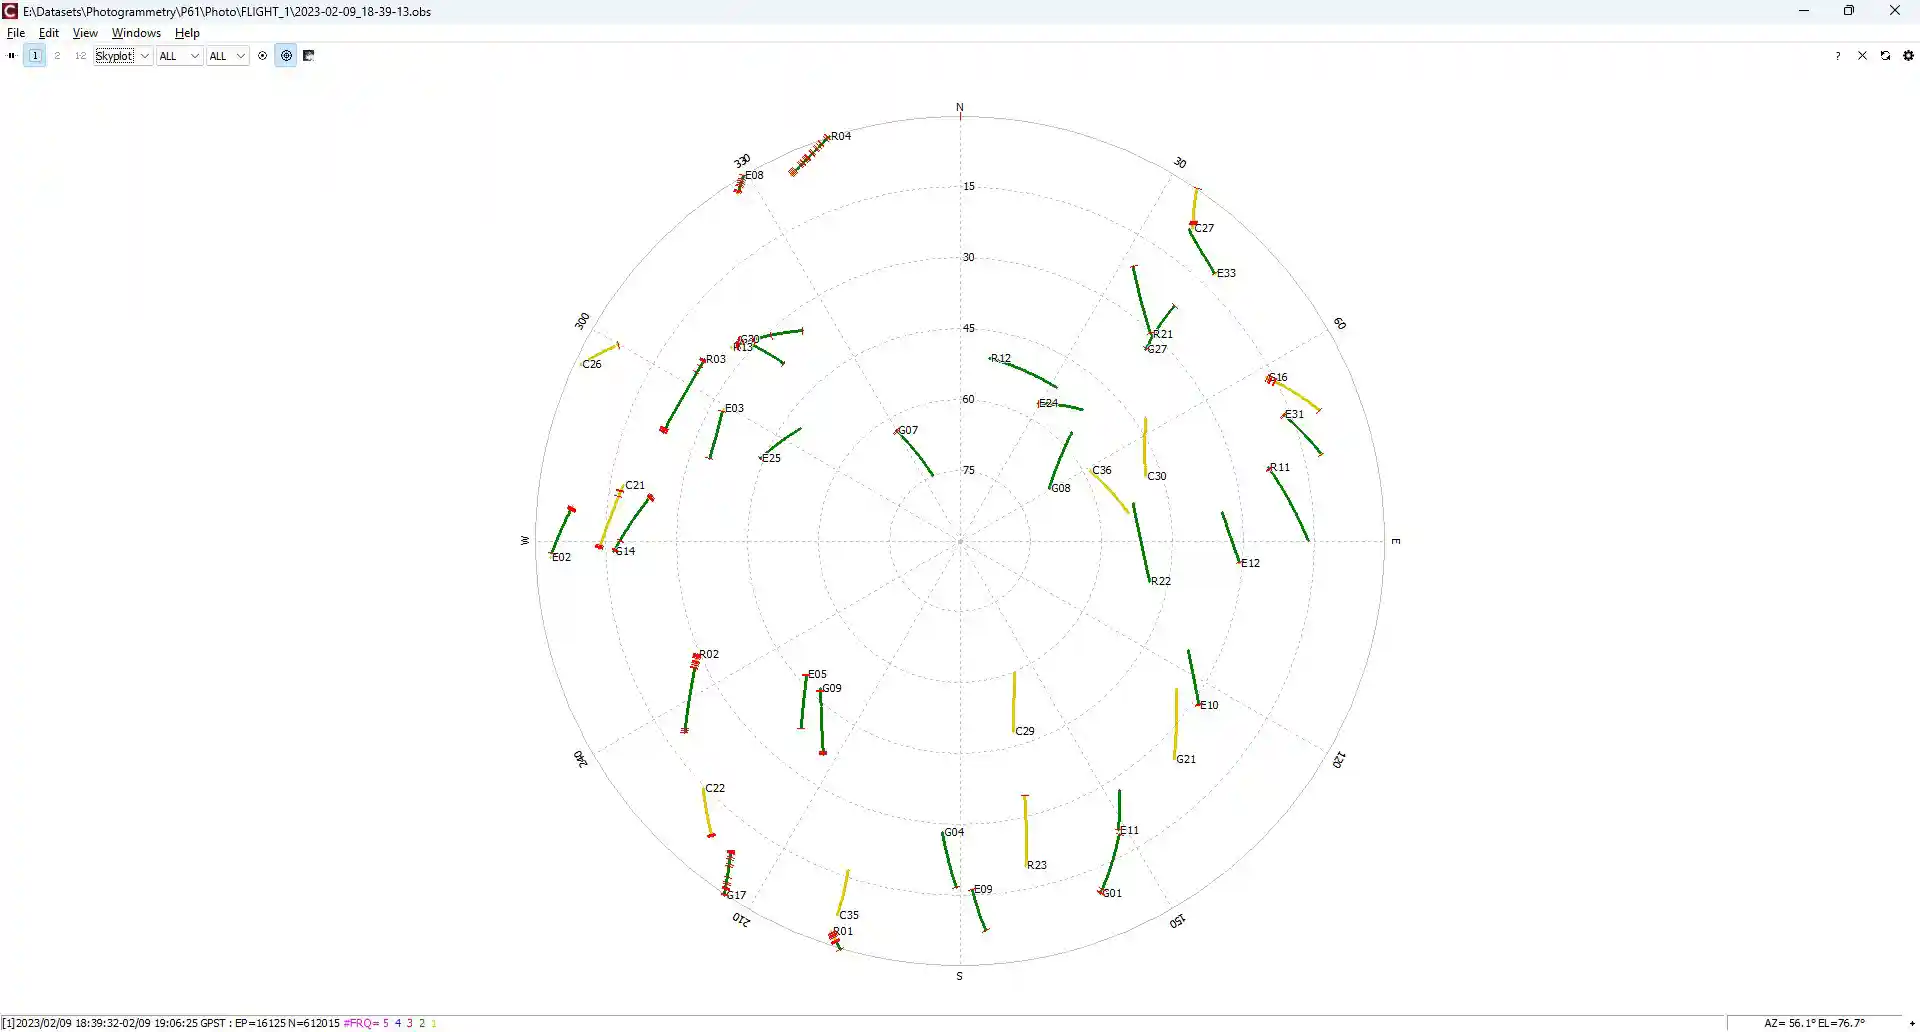
The Skyplot window visualizes GNSS satellite positions in a polar coordinate system, displaying their location in the celestial sphere relative to the receiver.
Diagram Structure:
The diagram is a circular "top-down" projection where:
-
Center represents the zenith (satellites directly above the receiver);
-
Outer circle denotes the horizon (satellites at minimum elevation angle);
-
Cardinal directions are standardized:
-
North (N) – top of the diagram,
-
East (E) – right side,
-
South (S) – bottom,
-
West (W) – left side.
-
The plot allows evaluation of:
-
Satellite distribution by azimuth and elevation angle;
-
Geometric diversity (critical for DOP calculation);
-
Potential signal obstruction zones (satellites near the horizon).
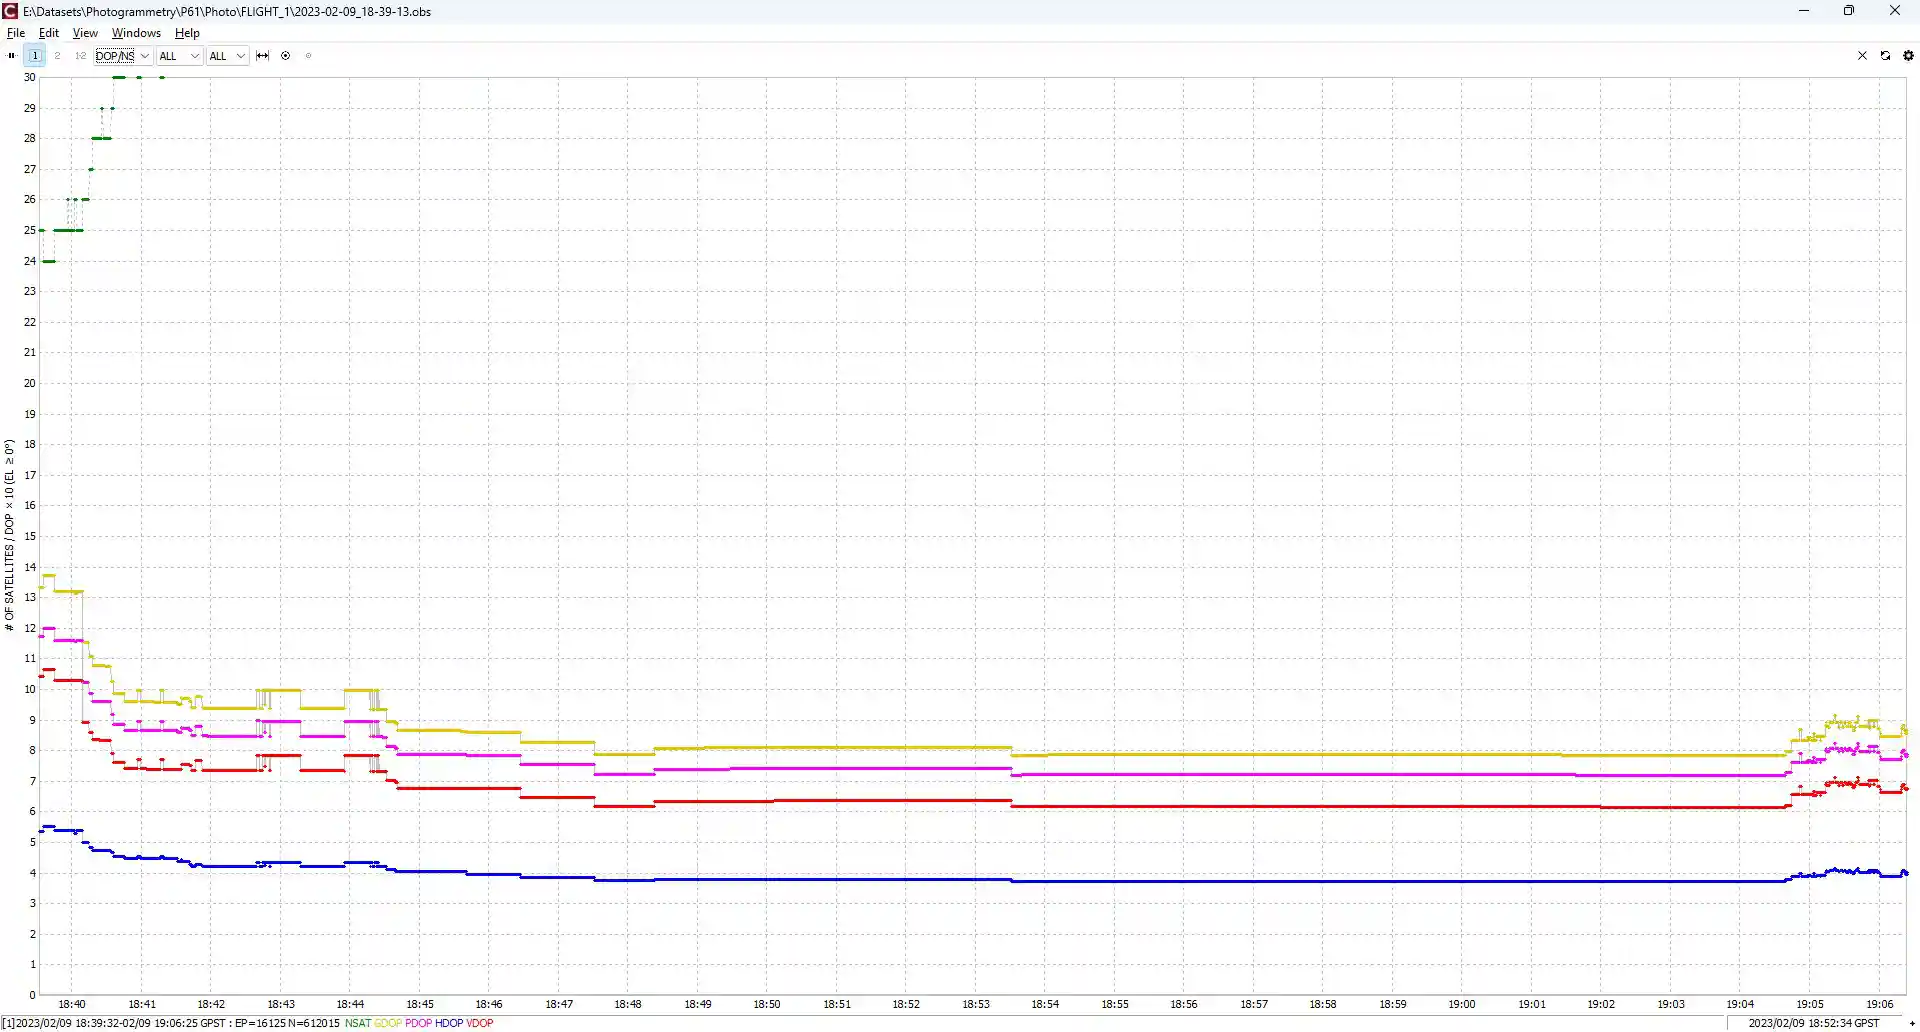
The DOP/NSat window provides key metrics for assessing GNSS positioning quality, reflecting both the spatial distribution of satellites and their quantity during measurements.
Key parameters:
-
DOP (Dilution Of Precision) - A coefficient quantifying the influence of satellite geometric configuration on positioning accuracy. The DOP value is determined by the relative positions of navigation satellites with respect to the receiver in three-dimensional space.
-
NSat (Number of Satellites) - A parameter indicating the number of satellites participating in the navigation solution at each time epoch.
DOP classification:
-
GDOP (Geometric DOP) - Comprehensive accuracy degradation metric for all components (3D coordinates + time offset)
-
PDOP (Position DOP) - Characterizes 3D positioning accuracy degradation (latitude, longitude, altitude)
-
HDOP (Horizontal DOP) - Reflects horizontal plane accuracy degradation (latitude, longitude)
-
VDOP (Vertical DOP) - Indicates height determination accuracy degradation. Under typical conditions, VDOP exceeds HDOP due to satellite constellation geometry specifics.
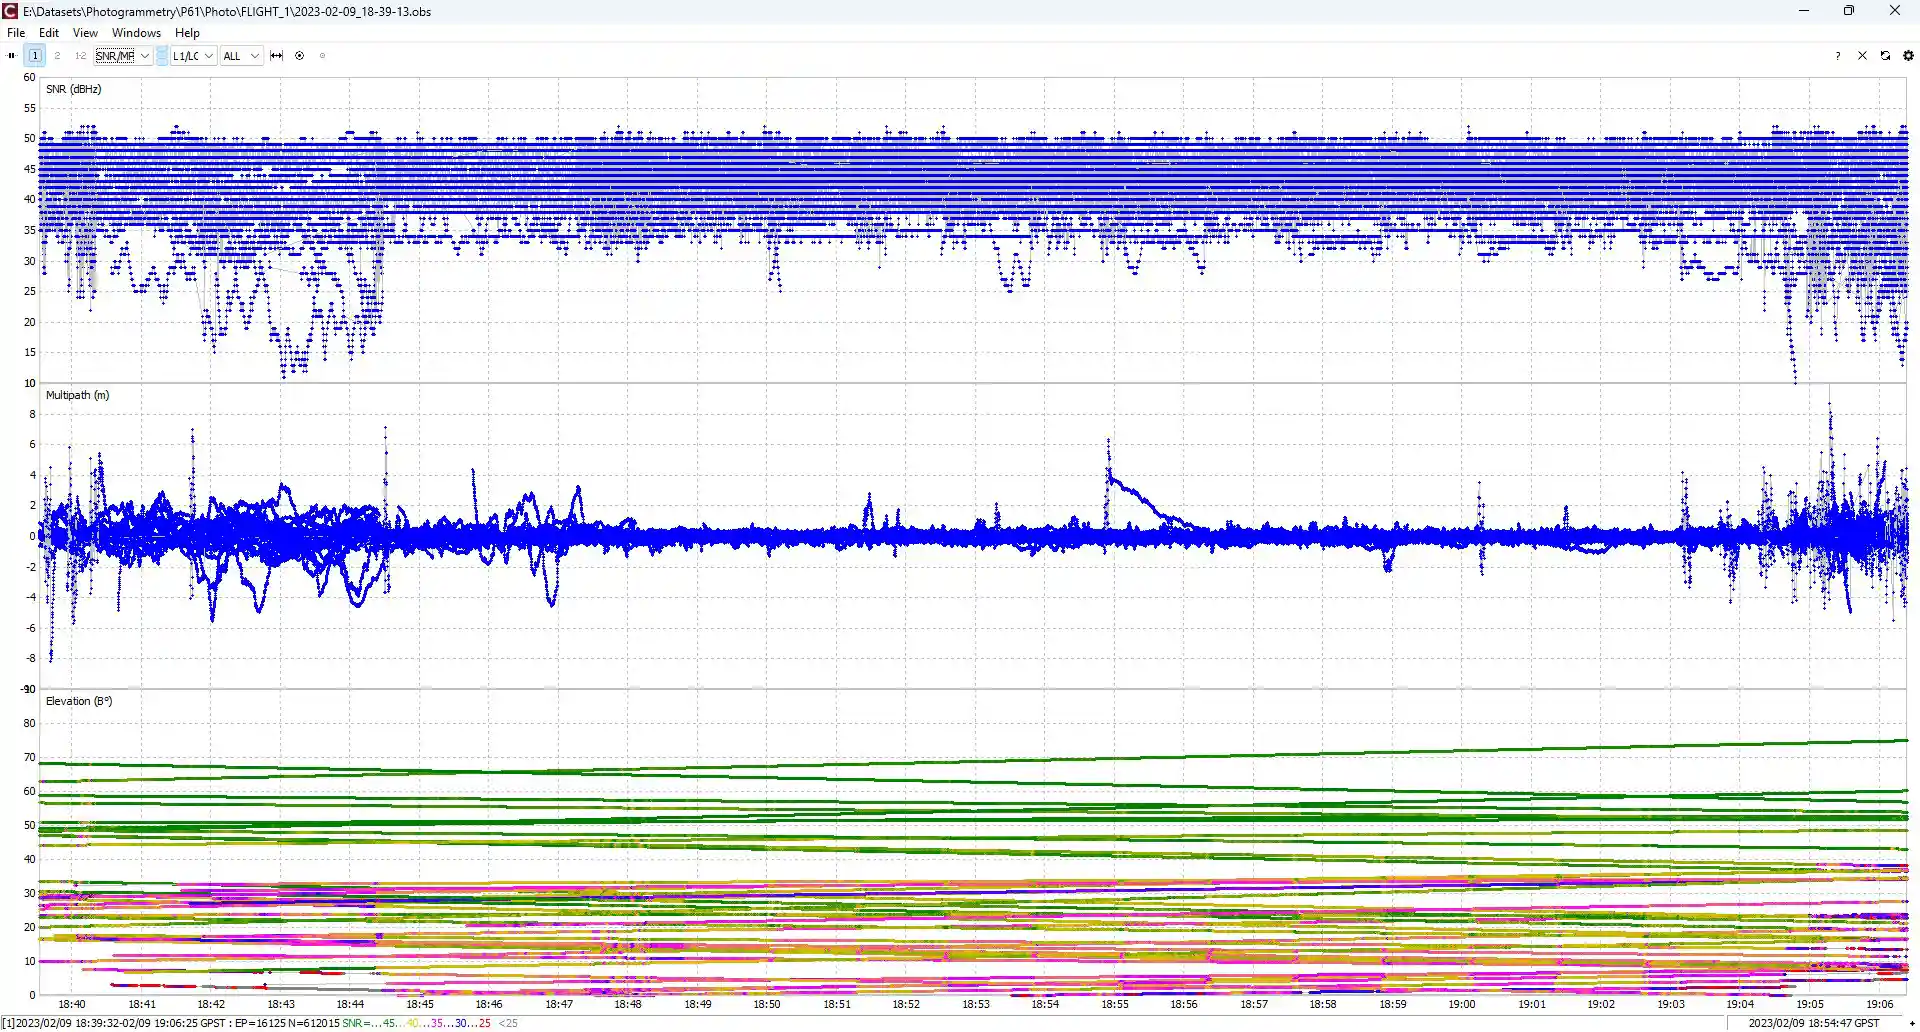
The SNR/MP/El window provides comprehensive diagnostics of key GNSS signal quality parameters. Let's examine the main parameters:
SNR (Signal-to-Noise Ratio) - The ratio of signal power to noise spectral density (dB-Hz).
-
Optimal values: >35 dB-Hz (high signal quality)
-
Critical values: <25 dB-Hz (risk of loss of lock)
MP (Multipath) - Phase distortions caused by multipath effects.
-
Evaluation scale:
- 0-0.5 m: negligible impact
- 0.5-1.0 m: moderate distortions
- 1 m: severe distortions due to reflected signals
El (Elevation Angle) - Satellite's vertical angle relative to local horizon (degrees).
-
Interpretation guidelines:
-
0°-15°: high noise and multipath zone
-
15°-30°: acceptable quality working zone
-
30° and above: optimal reception zone
-
Correlative parameter variations help identify:
Signal obstruction (simultaneous SNR and El drop)
Multipath effect (MP increase with stable SNR)
Atmospheric interference (sporadic SNR fluctuations)
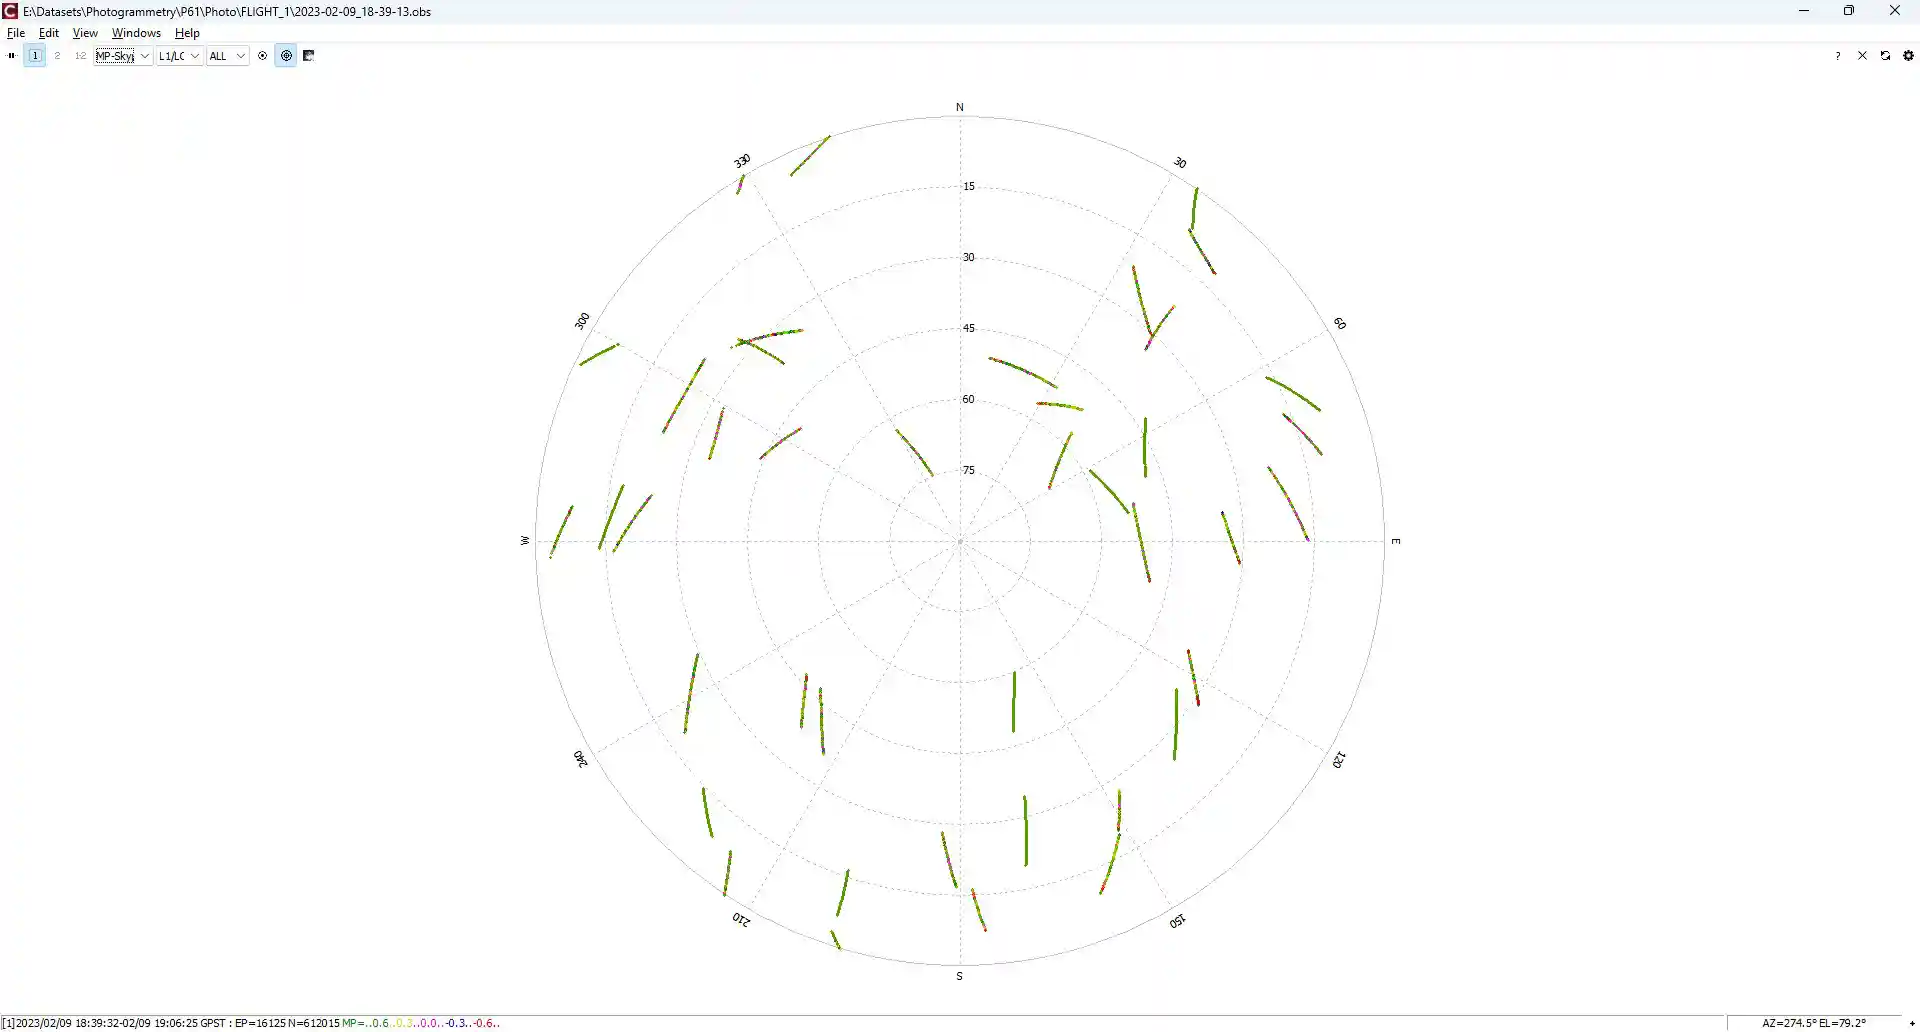
The MP-Skyplot window is a specialized visualization tool that combines multipath effect analysis with spatial satellite distribution in the celestial sphere.
This plot integrates:
-
Polar projection of satellite positions (similar to standard Skyplot)
-
Color/gradient indication of multipath distortion levels
Diagram structure features a circular top-down projection where:
-
Center represents the zenith (satellites directly above the receiver)
-
Circumference denotes the horizon (satellites at minimum elevation angle)
-
Cardinal directions follow standard orientation:
-
North (N) - top of diagram
-
East (E) - right side
-
South (S) - bottom
-
West (W) - left side
-
No Comments